> ## Documentation Index
> Fetch the complete documentation index at: https://docs.spurtest.com/llms.txt
> Use this file to discover all available pages before exploring further.
# Network & Console Monitoring
> Use Log steps to assert against network requests and console logs during test execution.
The Log step lets you validate what happens behind the scenes during a test run. Instead of checking what the user sees on screen (that's what [Verify](/authoring-tests/test-side-peek/step-types/verify) does), Log steps assert against **network requests** and **browser console output** — giving you visibility into API calls, error messages, and other under-the-hood behavior.
You describe what you expect in plain language, and the Spur agent intelligently searches through the captured data to verify your assertion. It returns the matching evidence — the endpoint, a data snippet, and timestamp — so you can see exactly what it found.
To learn how to add a Log step to your tests, see the [Log Step](/authoring-tests/test-side-peek/step-types/log/log-assertions) guide.
## Understanding the Result
When a Log step completes, Spur expands the result to show exactly how it verified your assertion. Here's what each part means:
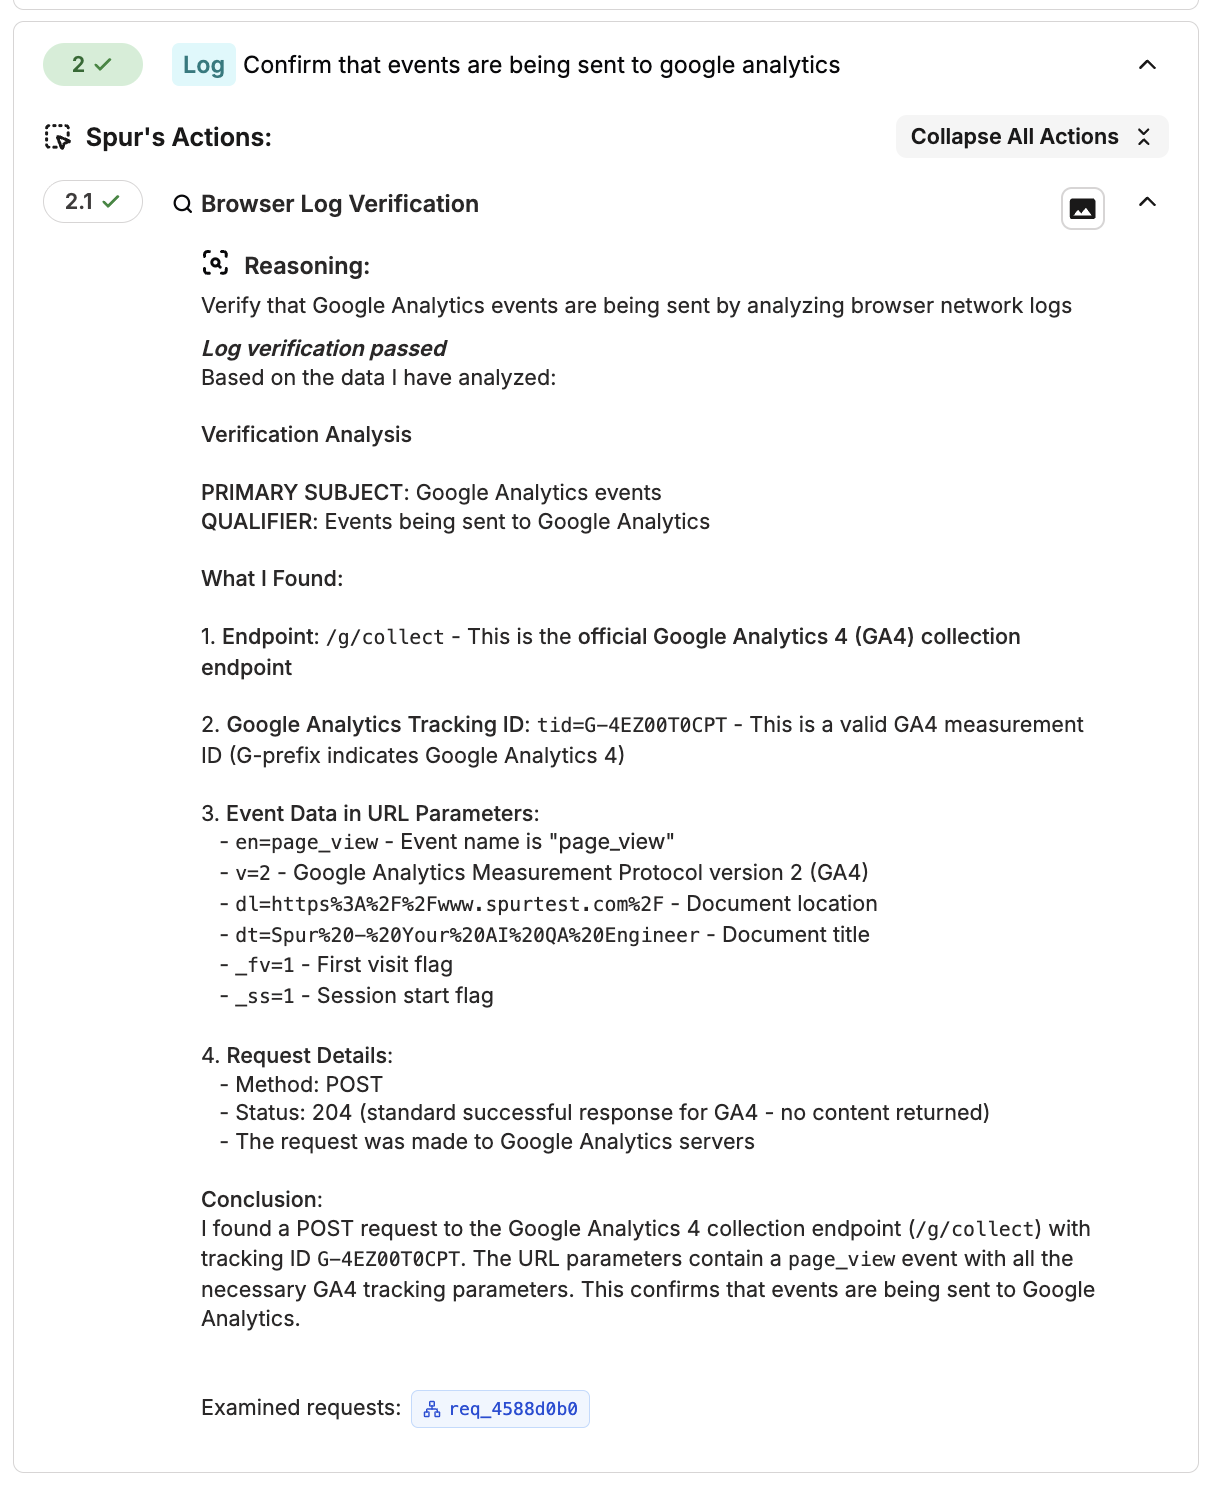 * **Reasoning** — The agent restates your assertion to confirm what it set out to verify.
* **Verification Analysis** — The agent breaks your assertion into a **primary subject** (the request or event type to find) and a **qualifier** (the specific condition to check within it). This is how the agent decides where to look and what to look for.
* **What I Found** — A detailed breakdown of the matching evidence, including the endpoint, request method, status code, URL parameters, and any relevant payload data. This is the raw proof that supports the result.
* **Conclusion** — A plain-language summary of whether the assertion passed or failed and why.
* **Examined requests** — A clickable badge linking to the specific network request the agent inspected. Click it to jump directly to the full request details in the Network Logs panel.
## Use Cases
### Event & Analytics Tracking
Analytics, tracking pixels, and third-party event calls break silently — they don't affect the UI, so regressions go unnoticed. Log steps let you confirm these events fire correctly during key user flows.
* **Reasoning** — The agent restates your assertion to confirm what it set out to verify.
* **Verification Analysis** — The agent breaks your assertion into a **primary subject** (the request or event type to find) and a **qualifier** (the specific condition to check within it). This is how the agent decides where to look and what to look for.
* **What I Found** — A detailed breakdown of the matching evidence, including the endpoint, request method, status code, URL parameters, and any relevant payload data. This is the raw proof that supports the result.
* **Conclusion** — A plain-language summary of whether the assertion passed or failed and why.
* **Examined requests** — A clickable badge linking to the specific network request the agent inspected. Click it to jump directly to the full request details in the Network Logs panel.
## Use Cases
### Event & Analytics Tracking
Analytics, tracking pixels, and third-party event calls break silently — they don't affect the UI, so regressions go unnoticed. Log steps let you confirm these events fire correctly during key user flows.

 ### Validate API Status Codes & Responses
The UI might show a success message even when the backend returns an error or unexpected data. Log steps let you check the actual API responses your application receives.
### Validate API Status Codes & Responses
The UI might show a success message even when the backend returns an error or unexpected data. Log steps let you check the actual API responses your application receives.


 ### Validate Request Payloads
Confirm that your application sends the correct data to the backend — not just that the form submitted successfully.
### Validate Request Payloads
Confirm that your application sends the correct data to the backend — not just that the form submitted successfully.

 ## What Data Is Available
During every test run, Spur captures all **network requests** and **browser console output** from your application. The Log step agent searches through this data to evaluate your assertions, and you can also inspect it directly from the test results view.
Every HTTP request and response, including:
* URL, method, and status code
* Request and response headers
* Request body (POST data)
* Response body
* Timing and duration
* Error details (HTTP and network errors)
All browser console output, including:
* Log messages (`console.log`, `console.warn`, `console.error`)
* JavaScript errors and stack traces
* Source file locations
* Timestamps
## Viewing Logs in Test Results
After a test run completes, you can inspect the raw network and console data directly from the results view.
### Network Logs
## What Data Is Available
During every test run, Spur captures all **network requests** and **browser console output** from your application. The Log step agent searches through this data to evaluate your assertions, and you can also inspect it directly from the test results view.
Every HTTP request and response, including:
* URL, method, and status code
* Request and response headers
* Request body (POST data)
* Response body
* Timing and duration
* Error details (HTTP and network errors)
All browser console output, including:
* Log messages (`console.log`, `console.warn`, `console.error`)
* JavaScript errors and stack traces
* Source file locations
* Timestamps
## Viewing Logs in Test Results
After a test run completes, you can inspect the raw network and console data directly from the results view.
### Network Logs
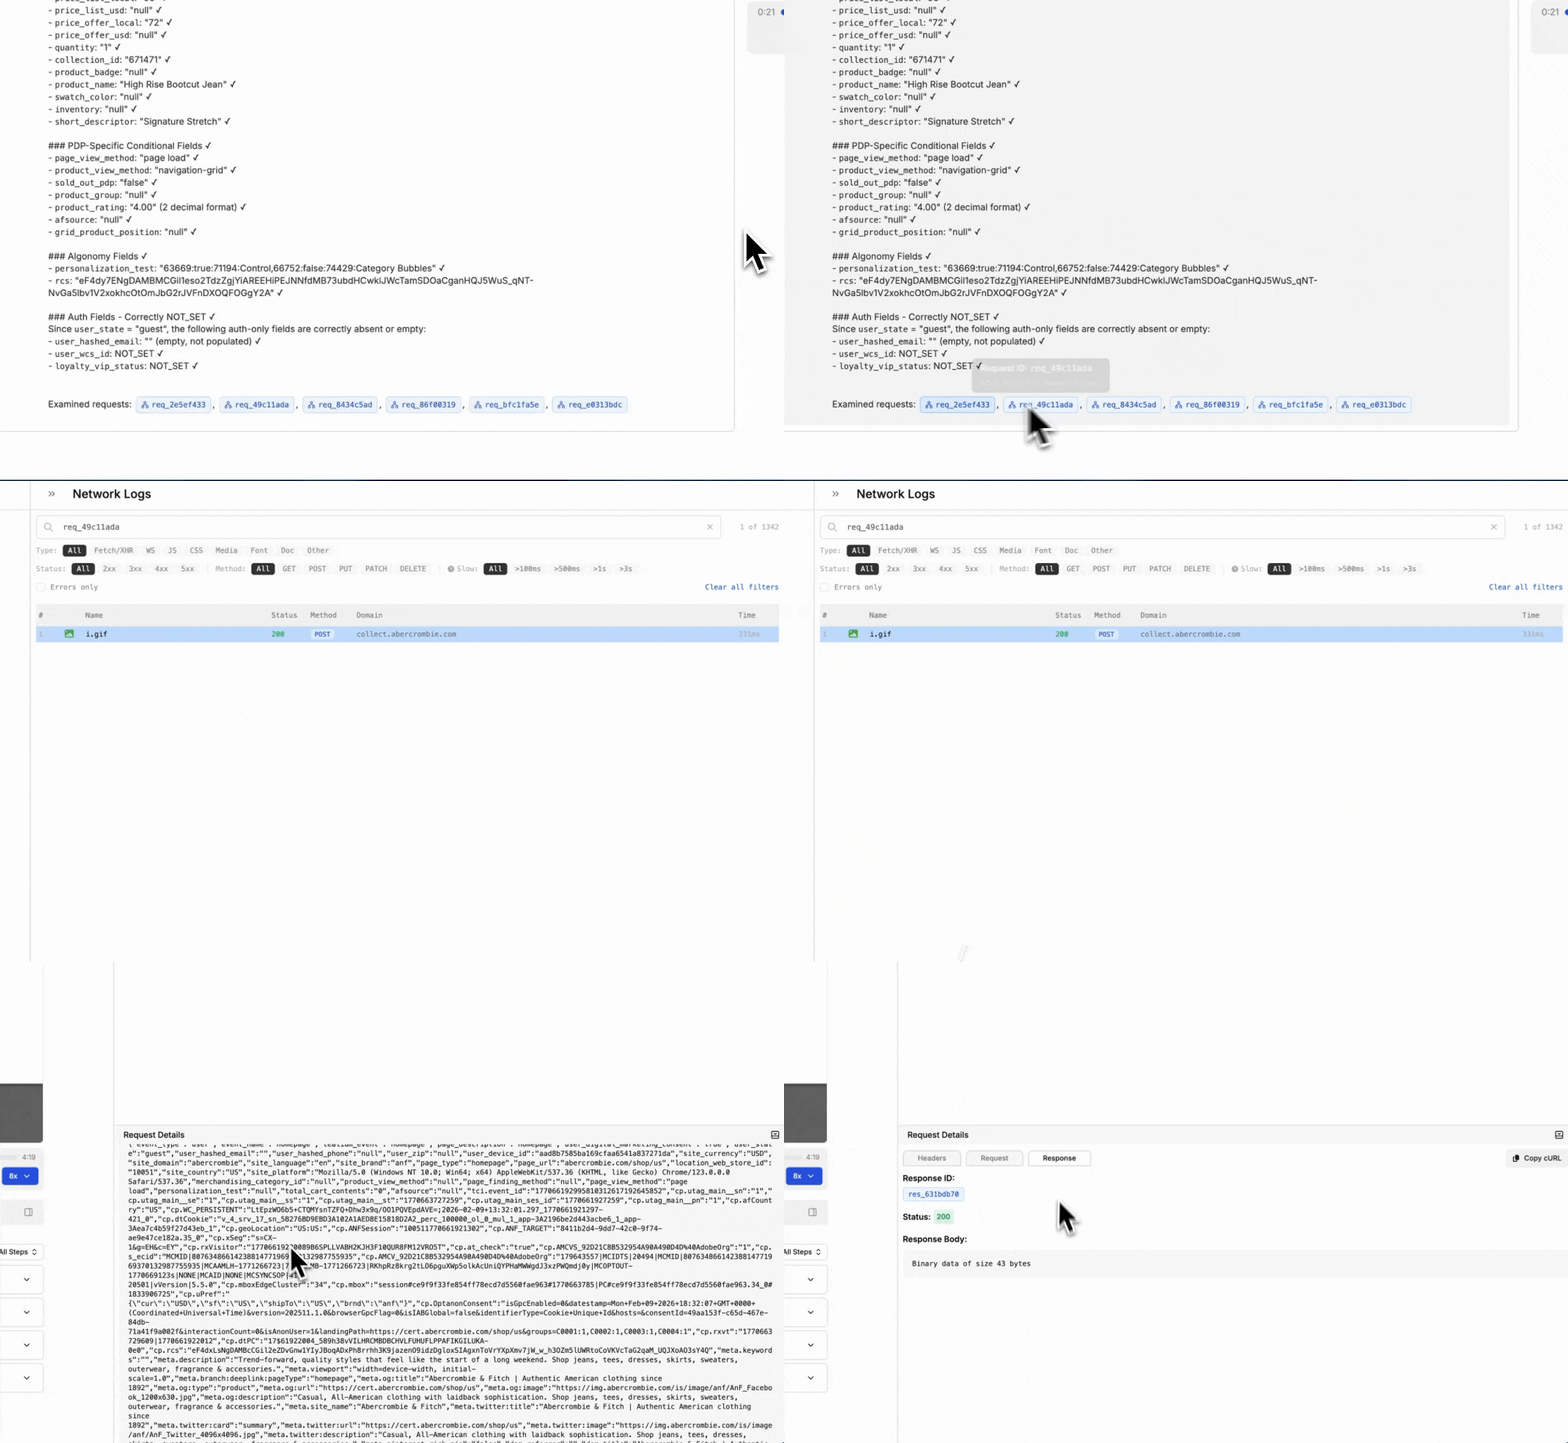 You can inspect the exact requests examined by the Spur agent by clicking the examined request in the step result.
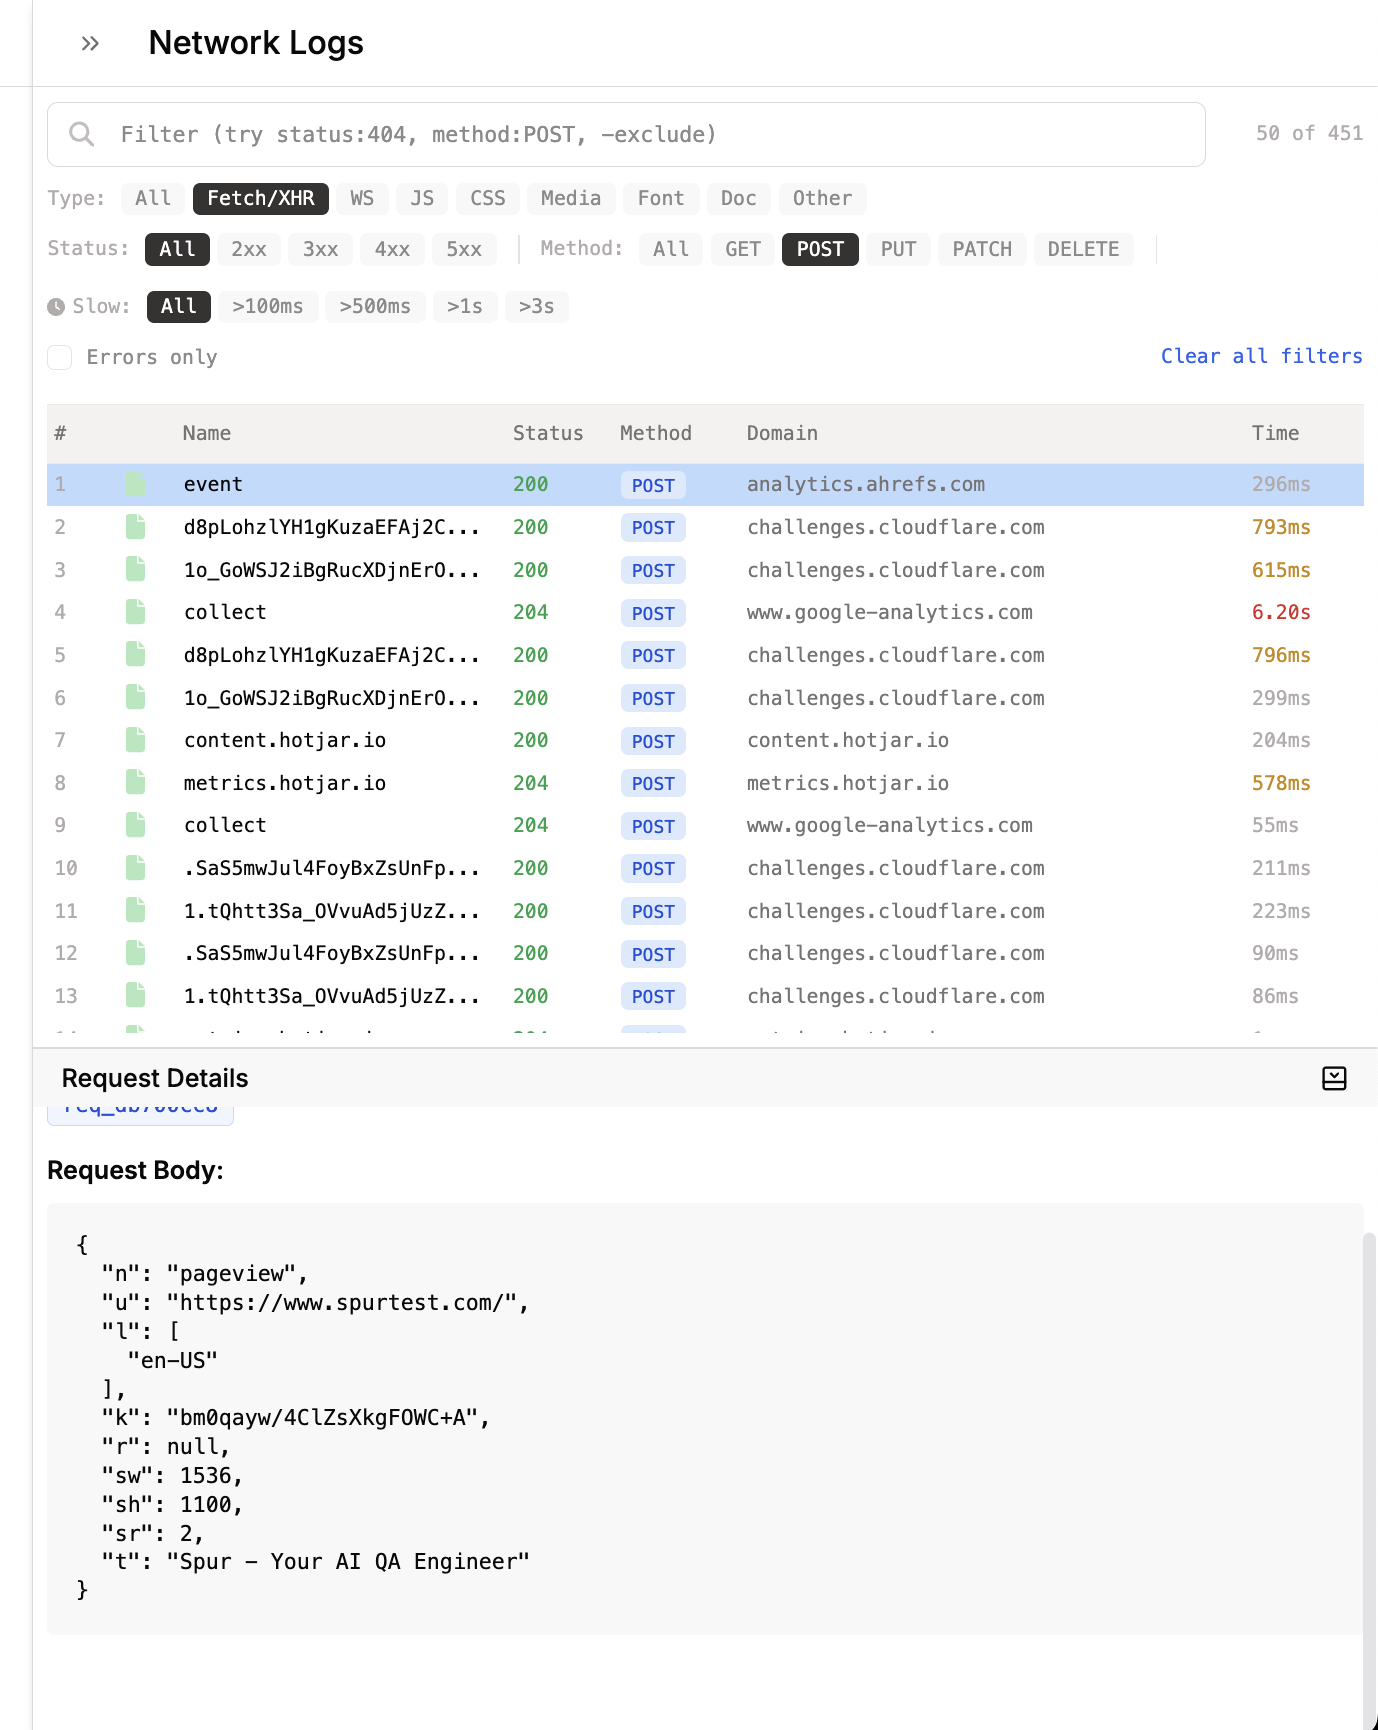 You can filter network logs by status code, HTTP method, or URL pattern. Click any entry to see full request and response details including headers and body content.
### Console Logs
You can filter network logs by status code, HTTP method, or URL pattern. Click any entry to see full request and response details including headers and body content.
### Console Logs
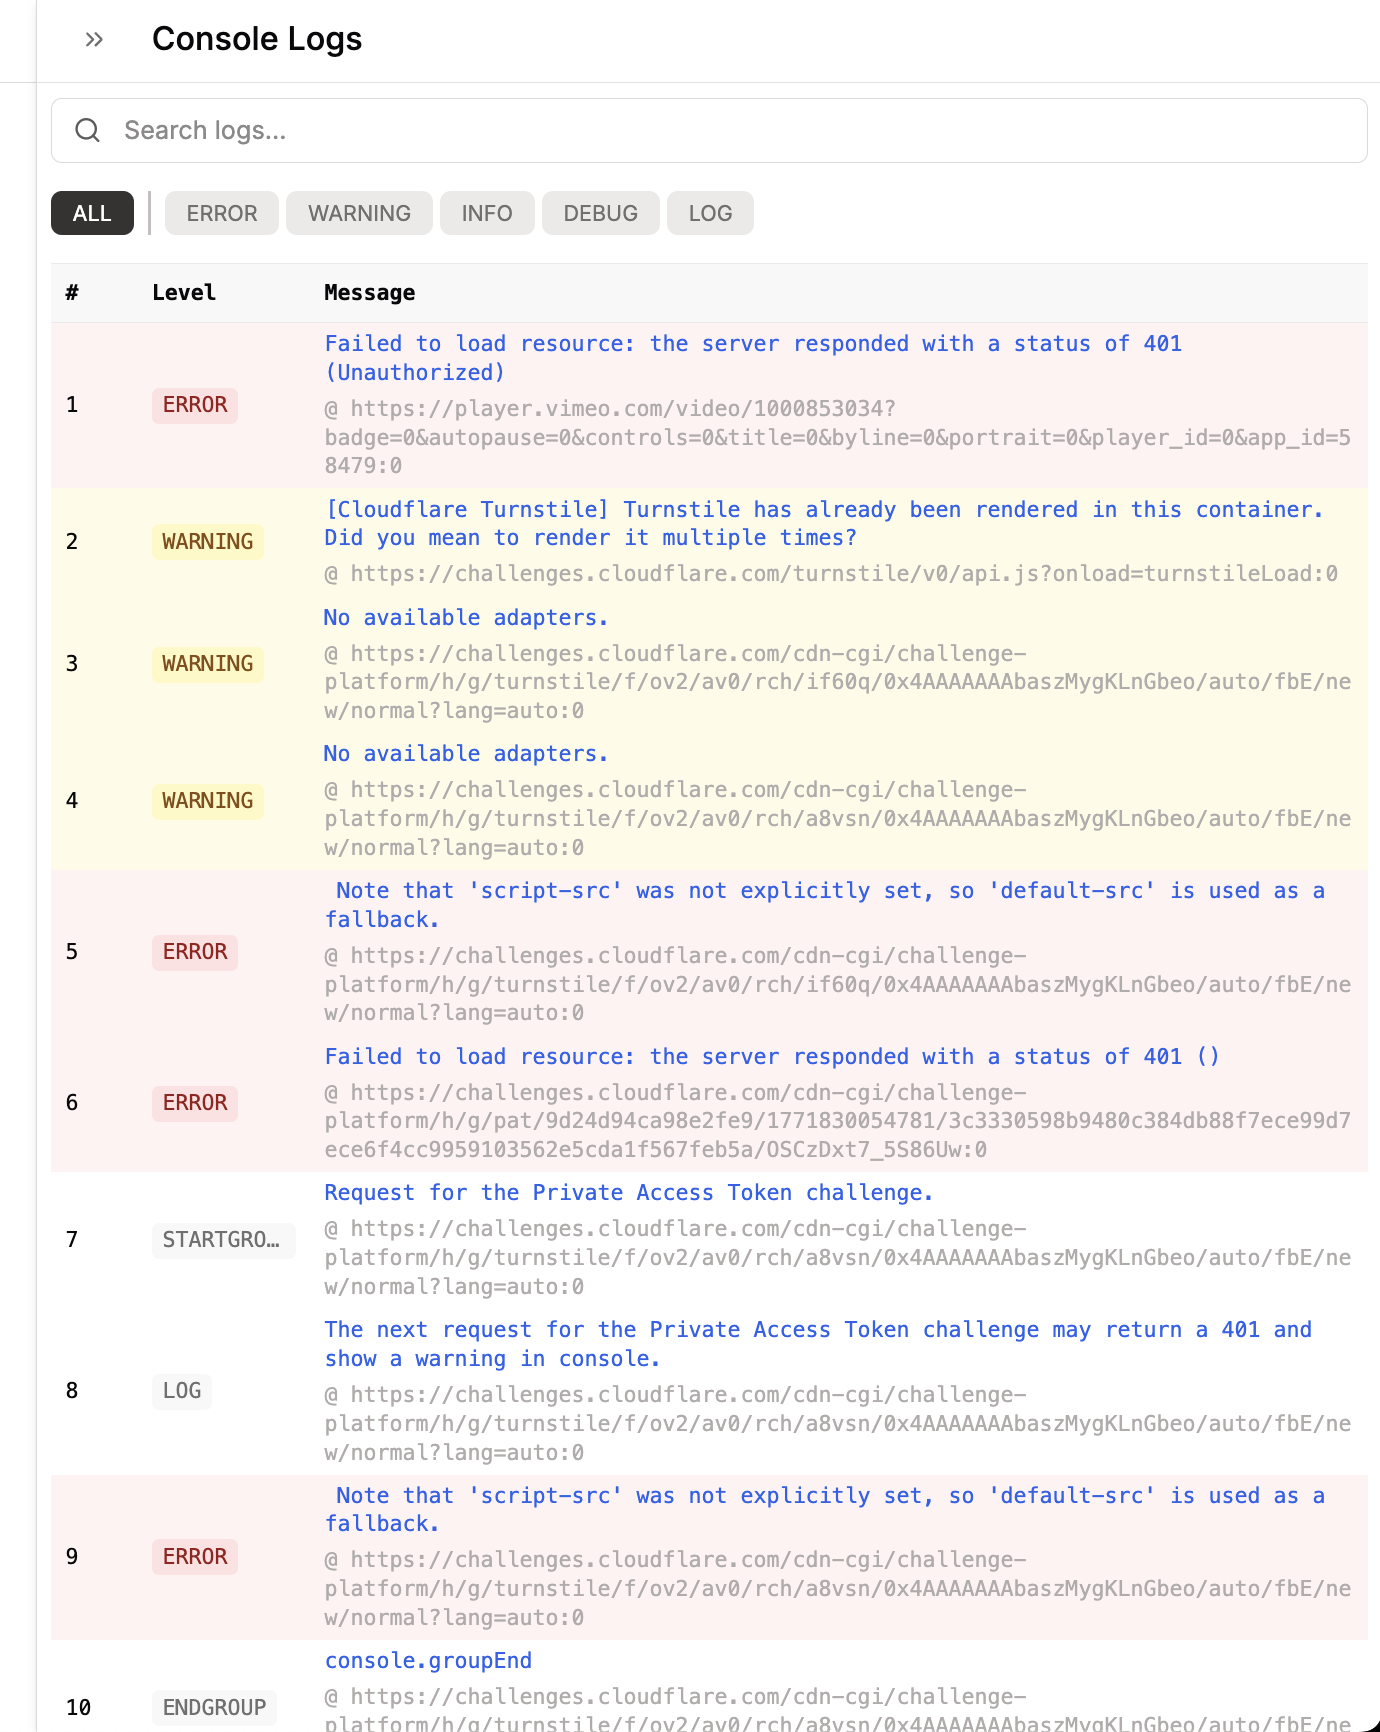 Console logs display the message type, timestamp, content, and source location. You can search and filter logs to find specific entries.
## Best Practices
### Writing Effective Assertions
Use a Verify step to check what the user sees, then follow it with a Log step to confirm the right data was sent and received. Together they give you full coverage — UI and backend in one test.
Console logs display the message type, timestamp, content, and source location. You can search and filter logs to find specific entries.
## Best Practices
### Writing Effective Assertions
Use a Verify step to check what the user sees, then follow it with a Log step to confirm the right data was sent and received. Together they give you full coverage — UI and backend in one test.
 Mention the specific assertion you want to perform: network or console. For example, "Validate the payload for collect-tag contains event\_code" should specify whether the agent needs to look for it in the console output or the network requests. So this should be rewritten as "Validate in the console ..."
Keep each Log step focused on a single check. Instead of "confirm the API returned 200 and the tracking event fired," split that into two separate Log steps. This makes results easier to interpret and debug.
Mention the specific assertion you want to perform: network or console. For example, "Validate the payload for collect-tag contains event\_code" should specify whether the agent needs to look for it in the console output or the network requests. So this should be rewritten as "Validate in the console ..."
Keep each Log step focused on a single check. Instead of "confirm the API returned 200 and the tracking event fired," split that into two separate Log steps. This makes results easier to interpret and debug.
 You don't need to know the exact request format, header names, or payload structure. Describe the behavior you expect and the agent will figure out where and how to look for it.
### When to Use Log Steps
Log steps are great for regression testing. Add them to your existing tests to make sure API behavior doesn't silently change between releases.
The UI might gracefully handle a 500 error or swallow a failed analytics call. Log steps surface these hidden issues that would otherwise go unnoticed.
Add Log steps to your most important user journeys — signup, form submissions, data updates, key workflows. These are the flows where a broken API call has real consequences.
Analytics, ad pixels, and third-party scripts break silently. Use Log steps to verify these calls fire on the right pages so you catch regressions early.
## Limitations
* **Logs are analyzed after capture, not in real-time.** The agent evaluates network and console data that has already been recorded during the test run. It does not monitor logs as they stream in.
* **Late-firing requests may not be captured.** If a network request or event fires after the test step has finished executing, it may not be included in the data the agent searches through. This can affect assertions on deferred or asynchronous calls that take a long time to complete.
## Troubleshooting
Make sure your assertion names the endpoint or event clearly. For example, instead of "Confirm the homepage event fired," try "Confirm the request to **/collect** contains **homepage** in the payload." Being specific about the endpoint helps the agent find the right request.
Try making your assertion more specific. Instead of "check the API response is correct," specify the exact endpoint, field, and expected value. A vague assertion could match unrelated data.
This usually means there's a real backend issue the UI is masking. Check the network logs panel in the test results to see the actual API responses.
Log steps are only available for web tests. If you're authoring a native/mobile test, this step type will not appear in the step menu.
You don't need to know the exact request format, header names, or payload structure. Describe the behavior you expect and the agent will figure out where and how to look for it.
### When to Use Log Steps
Log steps are great for regression testing. Add them to your existing tests to make sure API behavior doesn't silently change between releases.
The UI might gracefully handle a 500 error or swallow a failed analytics call. Log steps surface these hidden issues that would otherwise go unnoticed.
Add Log steps to your most important user journeys — signup, form submissions, data updates, key workflows. These are the flows where a broken API call has real consequences.
Analytics, ad pixels, and third-party scripts break silently. Use Log steps to verify these calls fire on the right pages so you catch regressions early.
## Limitations
* **Logs are analyzed after capture, not in real-time.** The agent evaluates network and console data that has already been recorded during the test run. It does not monitor logs as they stream in.
* **Late-firing requests may not be captured.** If a network request or event fires after the test step has finished executing, it may not be included in the data the agent searches through. This can affect assertions on deferred or asynchronous calls that take a long time to complete.
## Troubleshooting
Make sure your assertion names the endpoint or event clearly. For example, instead of "Confirm the homepage event fired," try "Confirm the request to **/collect** contains **homepage** in the payload." Being specific about the endpoint helps the agent find the right request.
Try making your assertion more specific. Instead of "check the API response is correct," specify the exact endpoint, field, and expected value. A vague assertion could match unrelated data.
This usually means there's a real backend issue the UI is masking. Check the network logs panel in the test results to see the actual API responses.
Log steps are only available for web tests. If you're authoring a native/mobile test, this step type will not appear in the step menu.