Flakiness Analysis
To specifically quantify the flakiness score in tests, you want to focus on how often the test fluctuates between passing and failing (i.e., where a test intermittently passes and fails without any apparent changes in the underlying code or environment). So, to quantify a flaky test the following definitions:- Fluctuations occur when a test result alternates between pass and fail in successive executions.
- The more frequent these alternations, the more “flaky” the test is considered to be.
Example of a Test Sequences:
- Test A: Pass, Fail, Pass, Pass, Fail, Pass → This shows fluctuations. (flaky)
- Test B: Pass, Pass, Pass → No fluctuations. (not flaky)
- Test C: Fail, Fail, Fail → Also no fluctuations, though it has a consistent failure. (not flaky)
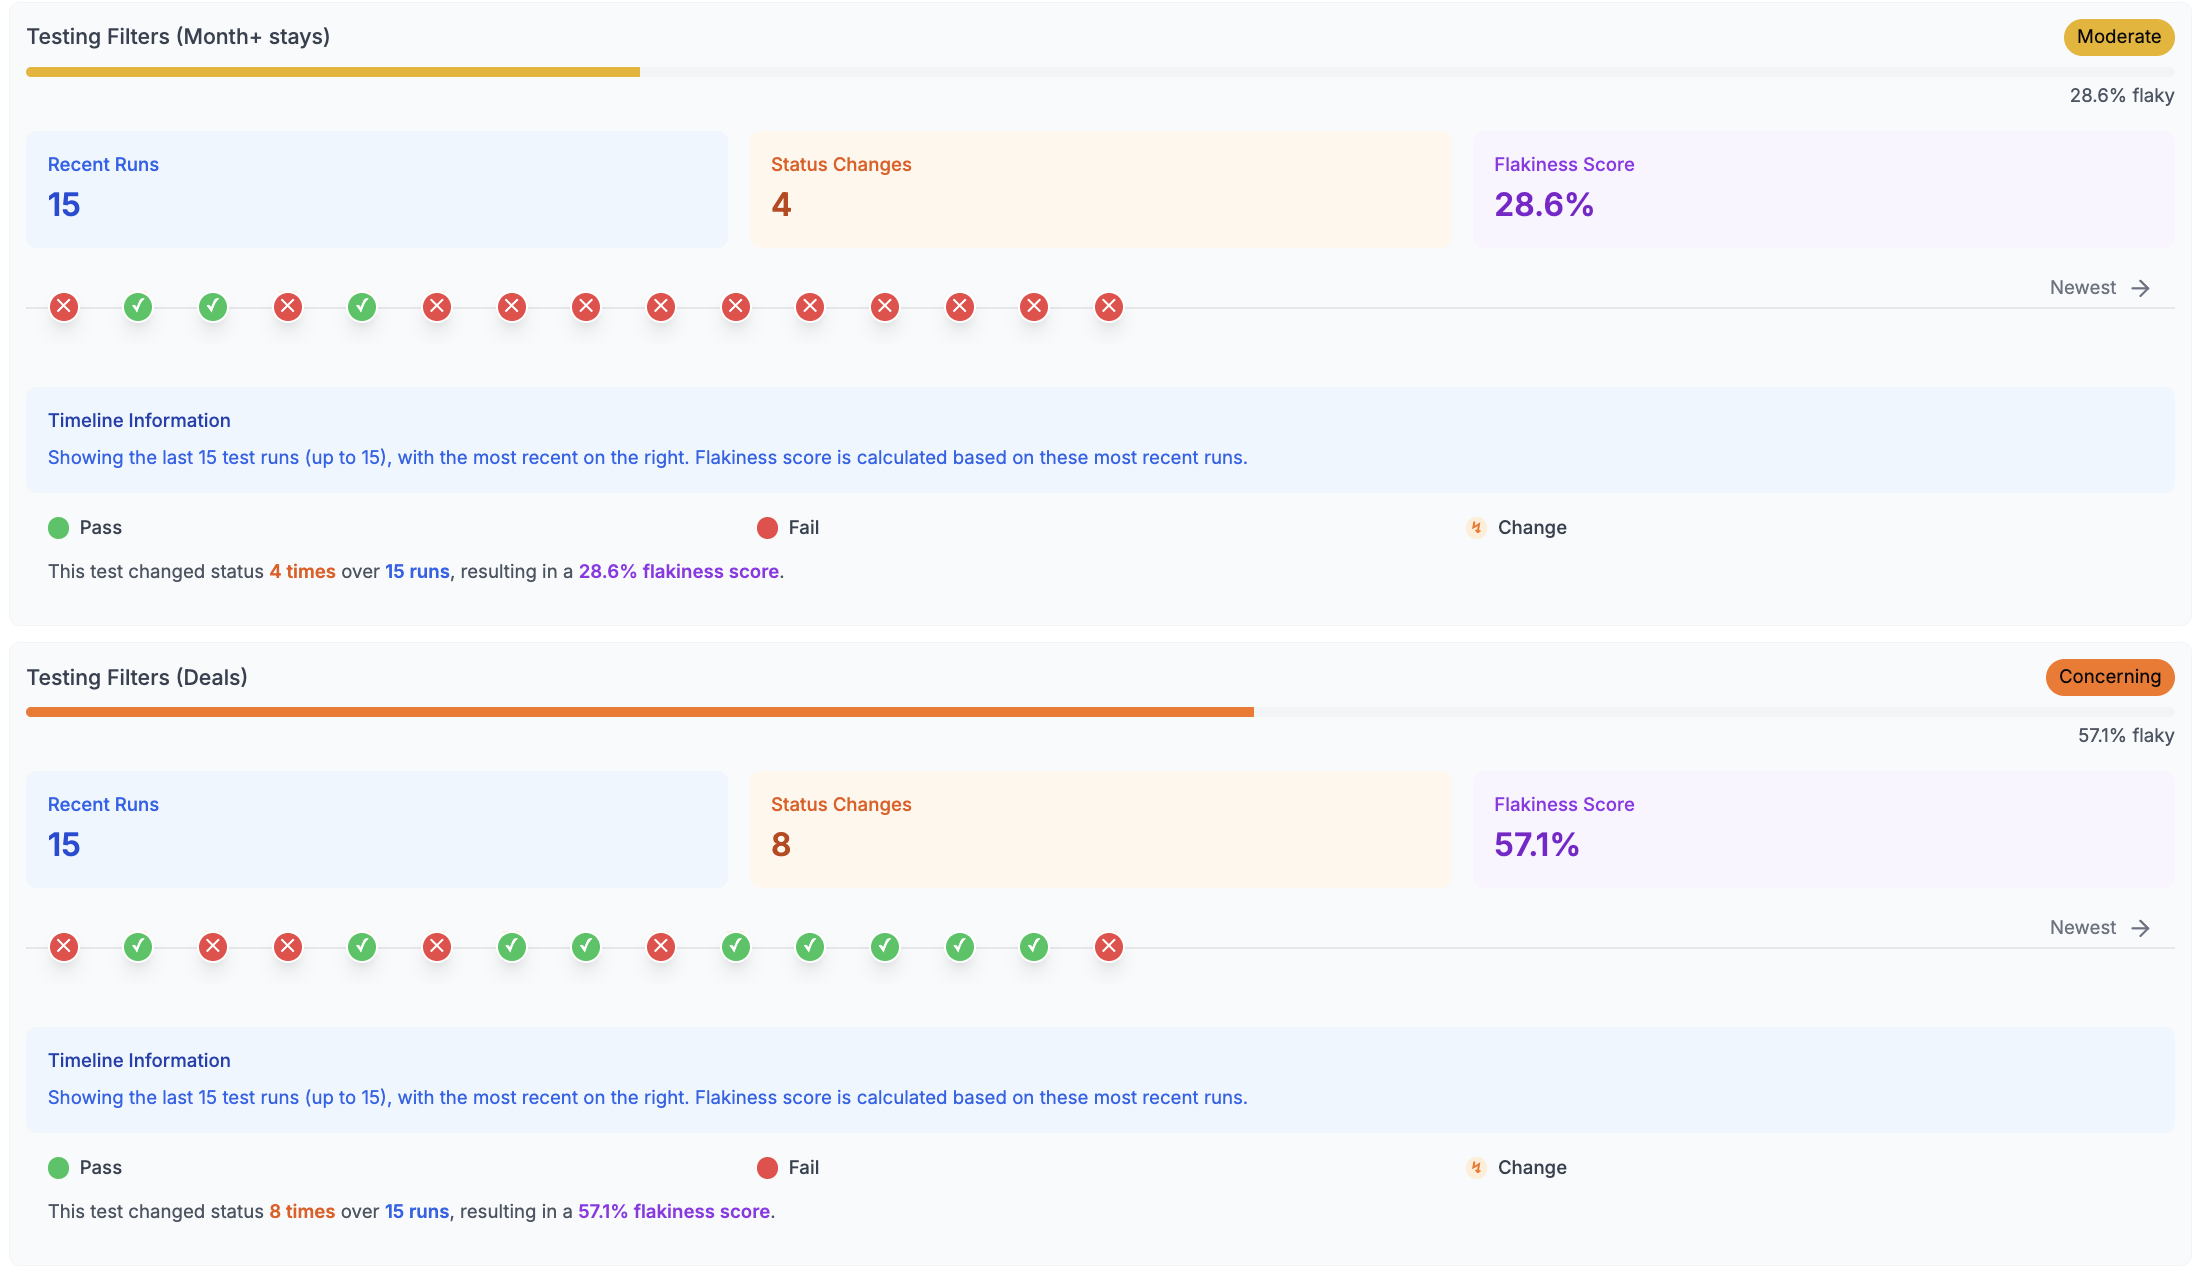
Calculating Flakiness Score
-
Track the status changes in a particular test within that test suite. For example,
- First Run: Pass
- Second Run: Fail
- Third Run: Pass
- Fourth Run: Pass
- The total number of status changes is 2
- The flakiness score is calculated as:
| Flakiness Score Range | Severity | Colour |
|---|---|---|
| More than 75 | Critical | Red |
| less than 75 | Concerning | Orange |
| less than 50 | Moderate | Yellow |
| less than 25 | Stable | Green |
| less than 0 | No Flaky Tests | No Flaky Tests |