Use Log steps to assert against network requests and console logs during test execution.
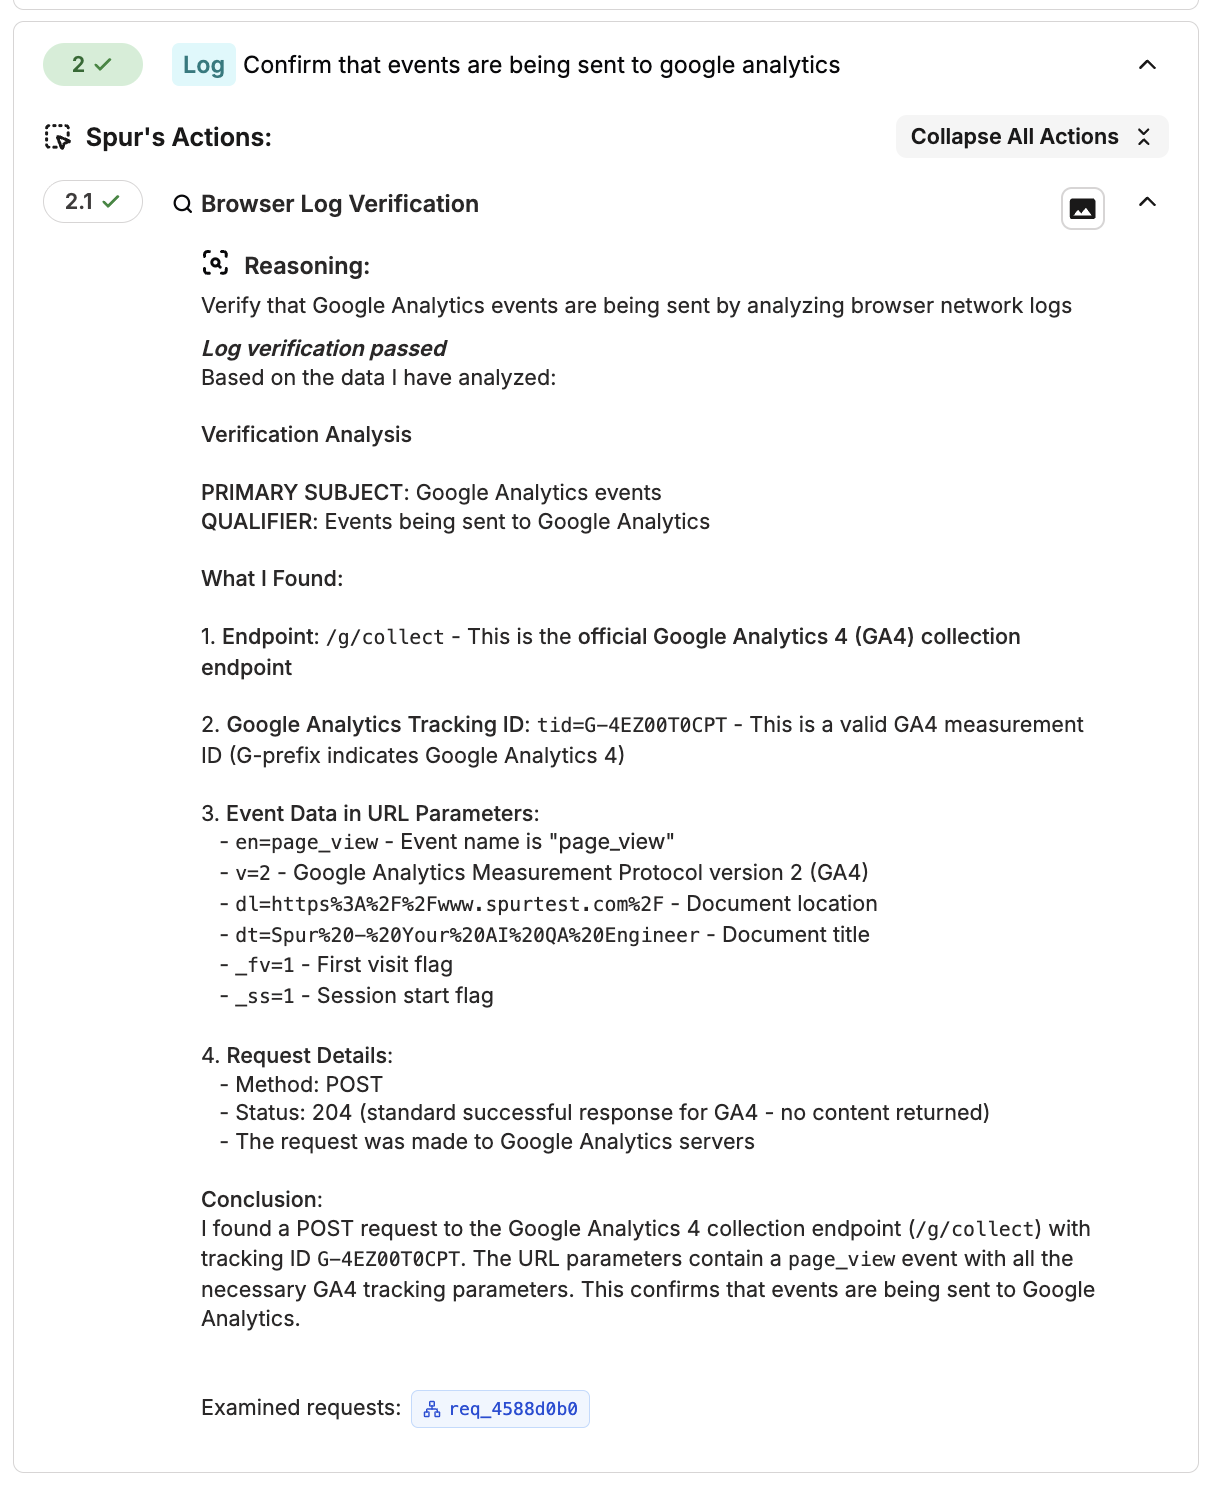
The Log step lets you validate what happens behind the scenes during a test run. Instead of checking what the user sees on screen (that’s what Verify does), Log steps assert against network requests and browser console output — giving you visibility into API calls, error messages, and other under-the-hood behavior.You describe what you expect in plain language, and the Spur agent intelligently searches through the captured data to verify your assertion. It returns the matching evidence — the endpoint, a data snippet, and timestamp — so you can see exactly what it found.
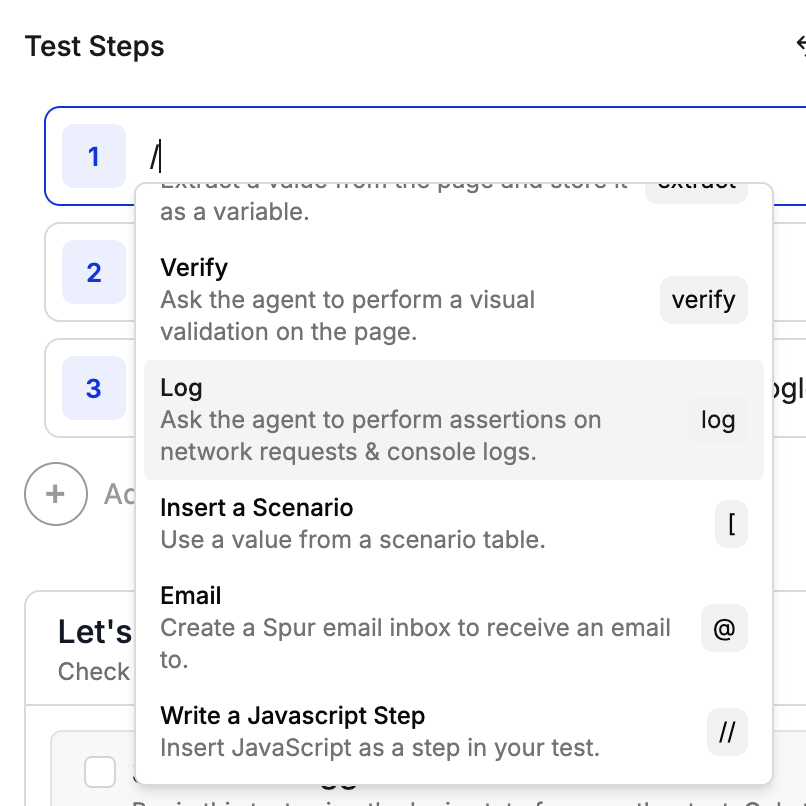
In the step editor, type log to insert a Log step. You can also type / and select Log from the step type menu.
Typing 'log' inserts a Log step with a teal badge
2
Write Your Assertion
After the Log prefix, describe what you want to validate in plain language. Spur Agent reads the actual network and console data captured during the run and evaluates your assertion.
Write a natural-language assertion about network or console behavior
3
Run and View Results
Execute the test. The Log step result shows whether your assertion passed or failed, along with the evidence the agent used to make its determination.
The Log step result shows pass/fail and supporting evidence
For use cases, available data, viewing logs in test results, best practices, limitations, and troubleshooting, see the full Network & Console Monitoring guide.
Was this page helpful?
⌘I
Assistant
Responses are generated using AI and may contain mistakes.